Spring Branch, Texas · 78070
River Crossing -homes sold in 2024
- Homes sold 1/1/2024 – 12/31/2024
- 27
- Actual sold price average (after seller concessions)
- $914,587
- Average square footage
- 3,626 sq ft
- Actual sold price median (after seller concessions)
- $880,772
- Net sold price per sq ft — with a pool
- $254.29 (average of 11 sales)
- Net sold price per sq ft — without a pool
- $252.19 (average of 16 sales)
- Average seller concession
- $3,154
- Average days to sell (CDOM)
- 143
Homes sold in 2024 by net sold price (after seller concessions)
| Price range | Homes sold | Avg cum daysAverage days to sell (CDOM) |
|---|---|---|
| Under $600K | 1 (4 % of total sales) | 61 |
| $600K – $699K | 2 (7 % of total sales) | 191 |
| $700K – $799K | 7 (26 % of total sales) | 139 |
| $800K – $899K | 5 (19 % of total sales) | 197 |
| $900K – $999K | 5 (19 % of total sales) | 143 |
| $1M – $1.199M | 4 (15 % of total sales) | 82 |
| $1.2M and over | 3 (11 % of total sales) | 139 |
0 SOLD & CLOSED IN DECEMBER 2024
1 SOLD & CLOSED IN NOVEMBER 2024
A single home changed hands in November. Cumulative time on market was 444 days, much slower than October's pace and the full-year average of 143 days.
NOTE: Texas is a non-disclosure State for real estate sold prices, hence the prices shown are the list prices when each home went under contract.
- Square footage
- 4,315 sq ft
- Days to sell (CDOM)
- 444
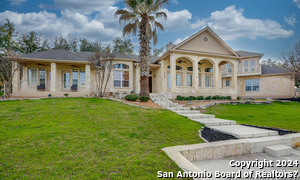 SOLDPool
3 SOLD & CLOSED IN OCTOBER 2024
Sales resumed in October with three homes closing at an average net price near $840,000, below the full-year average. Cumulative days on market averaged 173 days, pacing slower than the neighborhood's annual average of 143 days.
NOTE: Texas is a non-disclosure State for real estate sold prices, hence the prices shown are the list prices when each home went under contract.
- Actual sold price average (after seller concessions)
- $839,757
- Average square footage
- 3,556 sq ft
- Actual sold price median (after seller concessions)
- $880,772
- Average seller concession
- $1,409
- Average days to sell (CDOM)
- 173
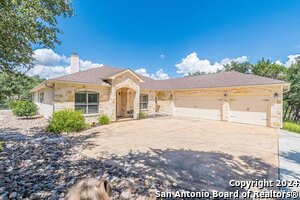 SOLD
 SOLD
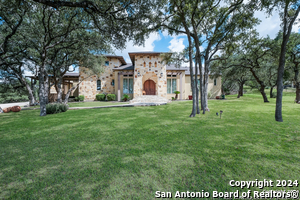 SOLD
0 SOLD & CLOSED IN SEPTEMBER 2024
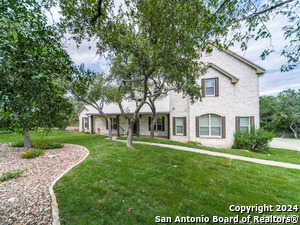
2 SOLD & CLOSED IN AUGUST 2024
Two homes sold in August at an average net price near $895,000, down modestly from July's level. Homes spent an average of just 35 cumulative days on market, making it the fastest-selling month of the year.
NOTE: Texas is a non-disclosure State for real estate sold prices, hence the prices shown are the list prices when each home went under contract.
- Actual sold price average (after seller concessions)
- $895,000
- Average square footage
- 3,148 sq ft
- Actual sold price median (after seller concessions)
- $895,000
- Average seller concession
- $0
- Average days to sell (CDOM)
- 35
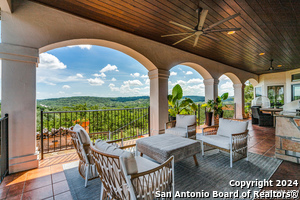 SOLD
 SOLD
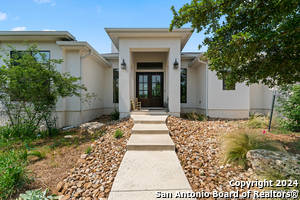
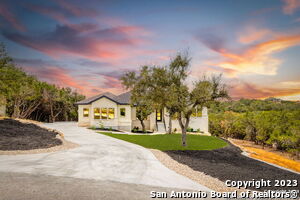
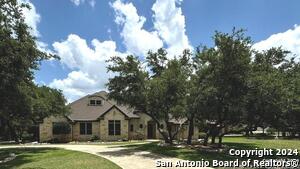
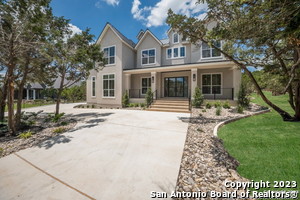
5 SOLD & CLOSED IN JULY 2024
Five homes closed in July with an average net price near $950,000, the highest average of any multi-sale month and above August. Cumulative days on market averaged 150 days, slightly slower than the annual average of 143 days.
NOTE: Texas is a non-disclosure State for real estate sold prices, hence the prices shown are the list prices when each home went under contract.
- Actual sold price average (after seller concessions)
- $948,590
- Average square footage
- 3,581 sq ft
- Actual sold price median (after seller concessions)
- $812,500
- Average seller concession
- $310
- Average days to sell (CDOM)
- 150
 SOLD
 SOLD
 SOLD
 SOLDPool
 SOLD
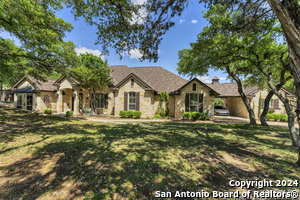
1 SOLD & CLOSED IN JUNE 2024
A single home sold in June following a quiet May. Cumulative time on market was 41 days, considerably faster than the full-year average of 143 days.
NOTE: Texas is a non-disclosure State for real estate sold prices, hence the prices shown are the list prices when each home went under contract.
- Square footage
- 3,432 sq ft
- Days to sell (CDOM)
- 41
 SOLD
0 SOLD & CLOSED IN MAY 2024
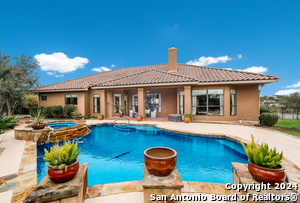
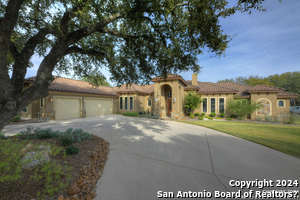
2 SOLD & CLOSED IN APRIL 2024
Two homes sold in April with an average net price near $890,000, softening from March's high mark. Properties moved swiftly with an average of 70 cumulative days on market, well ahead of March and the annual average of 143 days.
NOTE: Texas is a non-disclosure State for real estate sold prices, hence the prices shown are the list prices when each home went under contract.
- Actual sold price average (after seller concessions)
- $890,275
- Average square footage
- 3,317 sq ft
- Actual sold price median (after seller concessions)
- $890,275
- Average seller concession
- $5,975
- Average days to sell (CDOM)
- 70
 SOLDPool
 SOLD
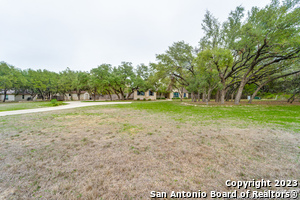
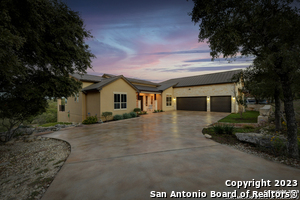
7 SOLD & CLOSED IN MARCH 2024
Activity peaked in March with seven homes sold at an average net price near $945,000, higher than both February and April. Homes averaged 178 cumulative days on market, tracking slower than neighboring months and the full-year average of 143 days.
NOTE: Texas is a non-disclosure State for real estate sold prices, hence the prices shown are the list prices when each home went under contract.
- Actual sold price average (after seller concessions)
- $943,887
- Average square footage
- 3,630 sq ft
- Actual sold price median (after seller concessions)
- $778,812
- Average seller concession
- $4,544
- Average days to sell (CDOM)
- 178
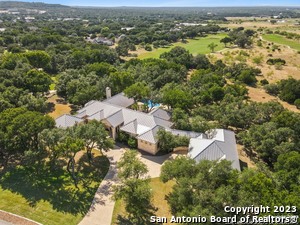 SOLDPool
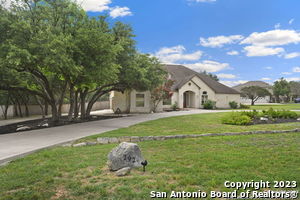 SOLD
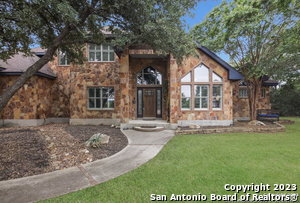 SOLD
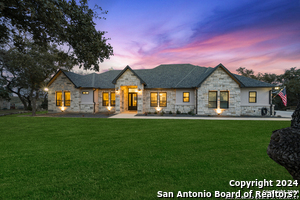 SOLDPool
 SOLDPool
 SOLDPool
 SOLD
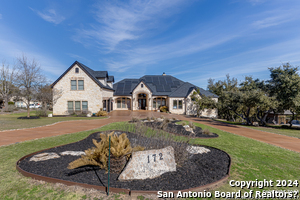
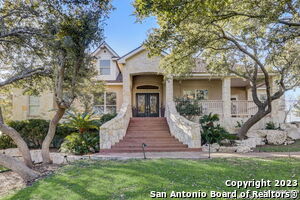
5 SOLD & CLOSED IN FEBRUARY 2024
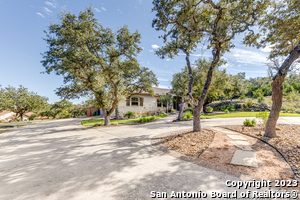
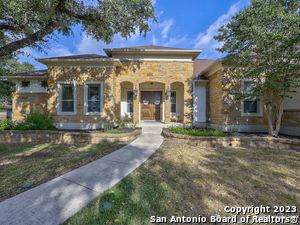
Five homes sold in February with an average net price near $835,000, coming in below March's level and the full-year average. Cumulative days on market averaged 77 days, moving much faster than the annual average of 143 days.
NOTE: Texas is a non-disclosure State for real estate sold prices, hence the prices shown are the list prices when each home went under contract.
- Actual sold price average (after seller concessions)
- $834,940
- Average square footage
- 3,632 sq ft
- Actual sold price median (after seller concessions)
- $779,000
- Average seller concession
- $5,960
- Average days to sell (CDOM)
- 77
 SOLDPool
 SOLD
 SOLDPool
 SOLDPool
 SOLD
1 SOLD & CLOSED IN JANUARY 2024
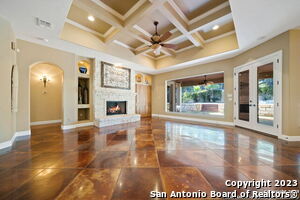
A single home sold in January to open the year. Cumulative time on market was 262 days, well above the neighborhood's full-year average of 143 days.
NOTE: Texas is a non-disclosure State for real estate sold prices, hence the prices shown are the list prices when each home went under contract.
- Square footage
- 5,091 sq ft
- Days to sell (CDOM)
- 262
 SOLDPool