Spring Branch, Texas · 78070
River Crossing -homes sold in 2025
- Homes sold 1/1/2025 – 12/31/2025
- 33
- Actual sold price average (after seller concessions)
- $892,503
- Average square footage
- 3,556 sq ft
- Actual sold price median (after seller concessions)
- $860,000
- Net sold price per sq ft — with a pool
- $262.87 (average of 19 sales)
- Net sold price per sq ft — without a pool
- $240.79 (average of 14 sales)
- Average seller concession
- $2,607
- Average days to sell (CDOM)
- 119
Homes sold in 2025 by net sold price (after seller concessions)
| Price range | Homes sold | Avg cum daysAverage days to sell (CDOM) |
|---|---|---|
| Under $600K | 2 (6 % of total sales) | 316 |
| $600K – $699K | 3 (9 % of total sales) | 103 |
| $700K – $799K | 8 (24 % of total sales) | 116 |
| $800K – $899K | 6 (18 % of total sales) | 51 |
| $900K – $999K | 5 (15 % of total sales) | 92 |
| $1M – $1.199M | 5 (15 % of total sales) | 189 |
| $1.2M and over | 4 (12 % of total sales) | 89 |
3 SOLD & CLOSED IN DECEMBER 2025
Three homes sold in December to close out the year, with an average net price near $1,110,000. Homes spent an average of 96 days on the market, moving faster than October's sales and the full-year average of 119 days.
NOTE: Texas is a non-disclosure State for real estate sold prices, hence the prices shown are the list prices when each home went under contract.
- Actual sold price average (after seller concessions)
- $1,110,167
- Average square footage
- 4,415 sq ft
- Actual sold price median (after seller concessions)
- $1,212,250
- Average seller concession
- $5,167
- Average days to sell (CDOM)
- 96
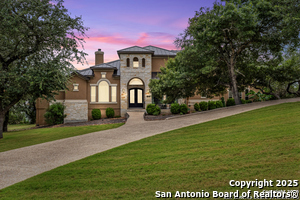 SOLDPool
 SOLDPool
 SOLDPool
0 SOLD & CLOSED IN NOVEMBER 2025
4 SOLD & CLOSED IN OCTOBER 2025
Four homes sold in October, with an average net price near $760,000, down from September's high. Days on market averaged 153 days, slower than September and above the annual average of 119 days.
NOTE: Texas is a non-disclosure State for real estate sold prices, hence the prices shown are the list prices when each home went under contract.
- Actual sold price average (after seller concessions)
- $758,563
- Average square footage
- 3,861 sq ft
- Actual sold price median (after seller concessions)
- $815,000
- Average seller concession
- $188
- Average days to sell (CDOM)
- 153
 SOLD
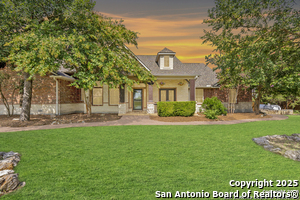 SOLD
 SOLDPool
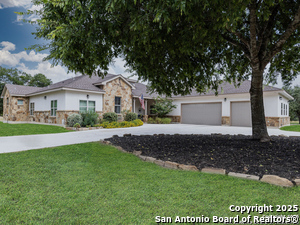 SOLD
2 SOLD & CLOSED IN SEPTEMBER 2025
Two homes sold in September with an average net price near $1,110,000, rising above August's level and October's average. Homes averaged 119 days on the market, faster than August and October while matching the full-year neighborhood average.
NOTE: Texas is a non-disclosure State for real estate sold prices, hence the prices shown are the list prices when each home went under contract.
- Actual sold price average (after seller concessions)
- $1,110,750
- Average square footage
- 3,510 sq ft
- Actual sold price median (after seller concessions)
- $1,110,750
- Average seller concession
- $0
- Average days to sell (CDOM)
- 119
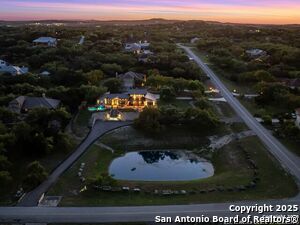
 SOLDPool
 SOLDPool
3 SOLD & CLOSED IN AUGUST 2025
Three homes closed in August, with an average net price near $950,000—higher than July's mark but below September. Cumulative days on market rose to 209 days, considerably slower than both neighboring months and the annual average of 119 days.
NOTE: Texas is a non-disclosure State for real estate sold prices, hence the prices shown are the list prices when each home went under contract.
- Actual sold price average (after seller concessions)
- $948,117
- Average square footage
- 3,770 sq ft
- Actual sold price median (after seller concessions)
- $1,075,000
- Average seller concession
- $217
- Average days to sell (CDOM)
- 209
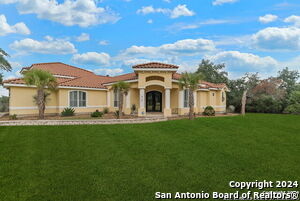 SOLD
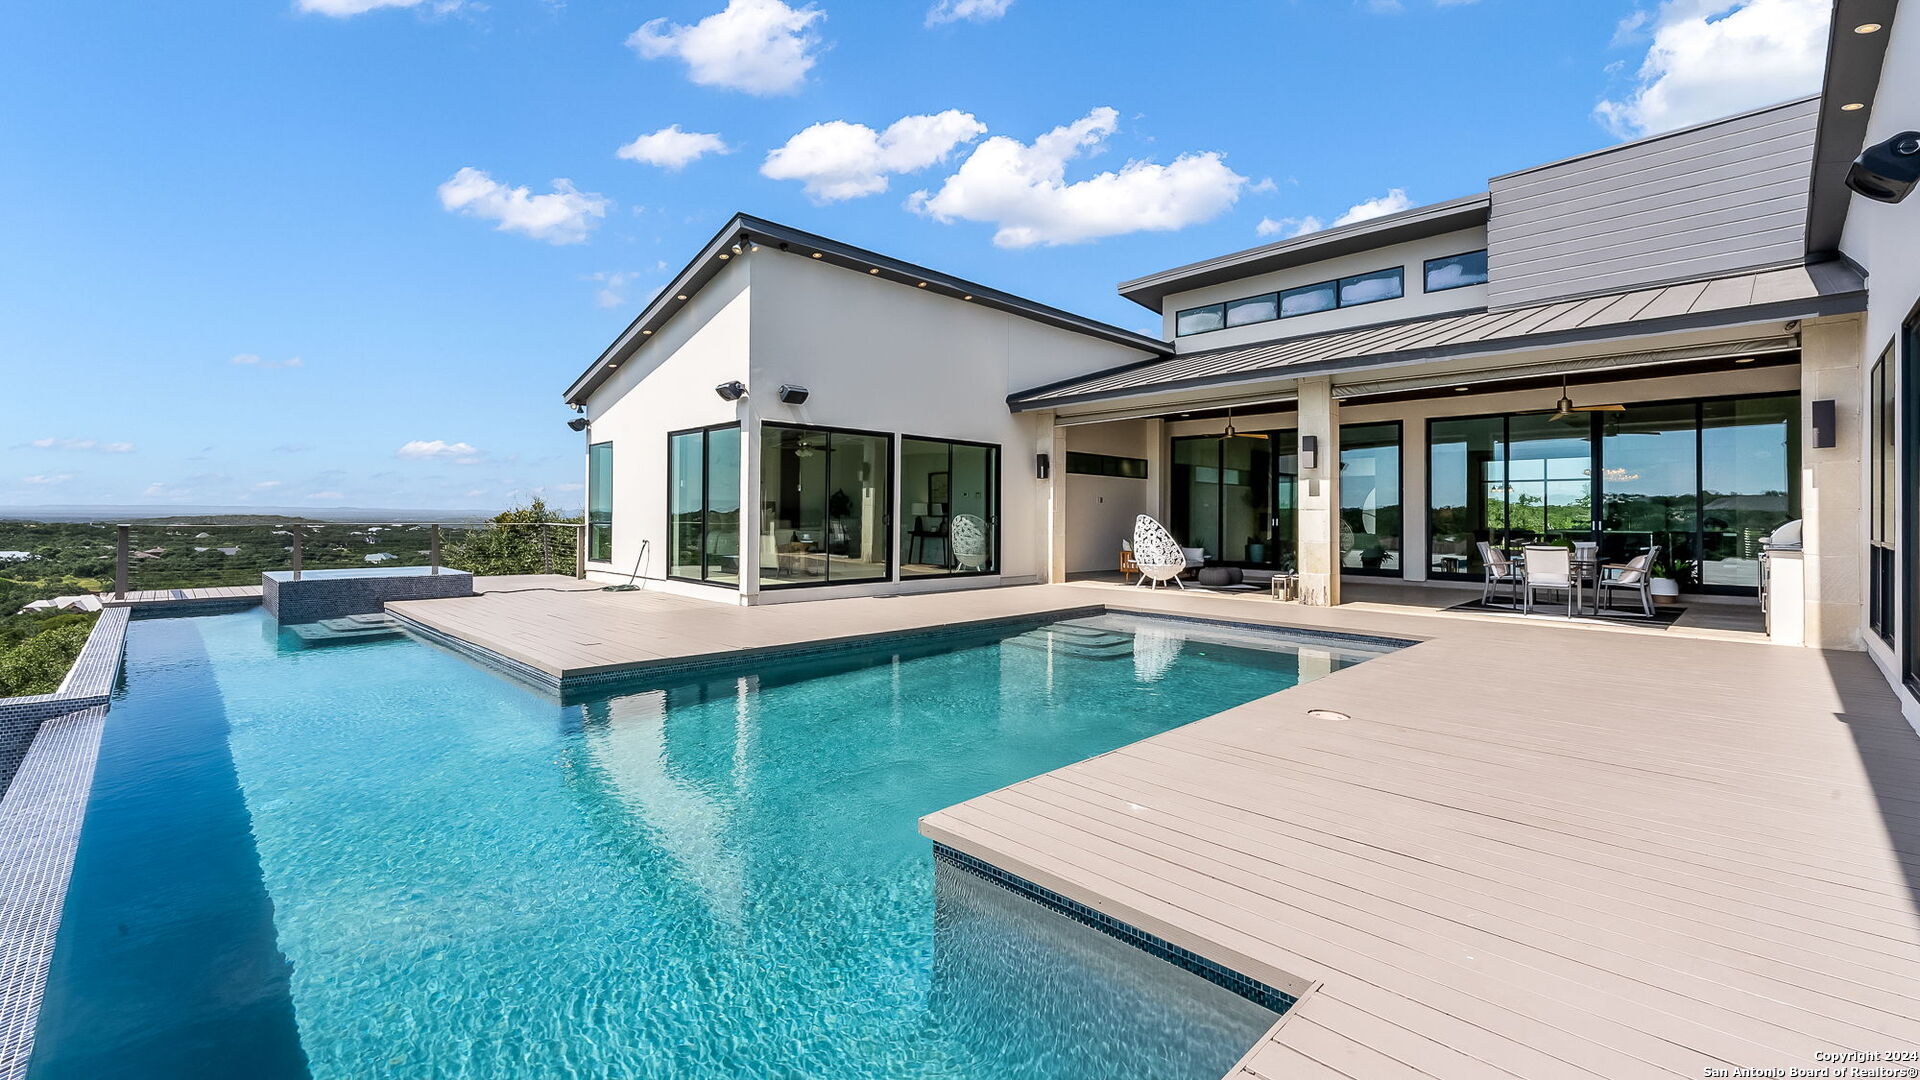 SOLDPool
 SOLDPool
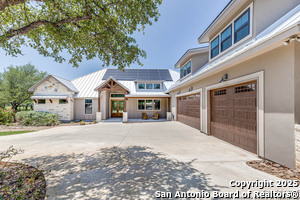
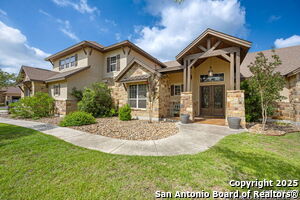
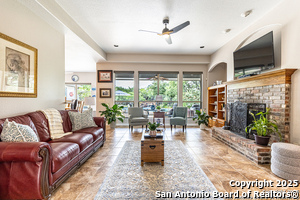
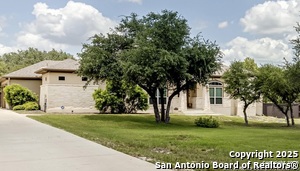
6 SOLD & CLOSED IN JULY 2025
July was the busiest month of the year with six homes sold, averaging a net price near $885,000. Properties spent an average of 74 days on the market, slower than June but much faster than August and the full-year average of 119 days.
NOTE: Texas is a non-disclosure State for real estate sold prices, hence the prices shown are the list prices when each home went under contract.
- Actual sold price average (after seller concessions)
- $885,370
- Average square footage
- 3,282 sq ft
- Actual sold price median (after seller concessions)
- $835,000
- Average seller concession
- $2,833
- Average days to sell (CDOM)
- 74
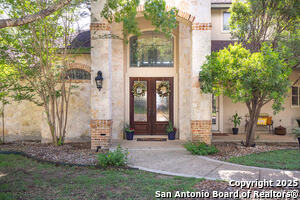 SOLD
 SOLDPool
 SOLD
 SOLDPool
 SOLD
 SOLDPool
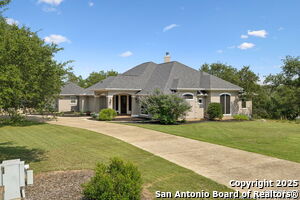
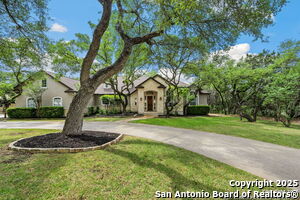
3 SOLD & CLOSED IN JUNE 2025
Three homes sold in June, with an average net price near $855,000—higher than May and slightly below July. Time on market averaged 30 days, keeping pace with May and running well ahead of the full-year average of 119 days.
NOTE: Texas is a non-disclosure State for real estate sold prices, hence the prices shown are the list prices when each home went under contract.
- Actual sold price average (after seller concessions)
- $854,667
- Average square footage
- 3,075 sq ft
- Actual sold price median (after seller concessions)
- $872,000
- Average seller concession
- $2,667
- Average days to sell (CDOM)
- 30
 SOLDPool
 SOLDPool
 SOLDPool
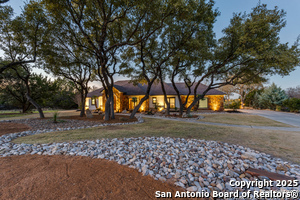
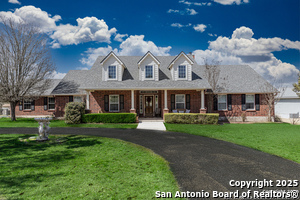
3 SOLD & CLOSED IN MAY 2025
Three homes sold in May with an average net price near $760,000, coming in lower than April and June. Properties spent just 29 days on the market, moving significantly faster than April and well below the annual average of 119 days.
NOTE: Texas is a non-disclosure State for real estate sold prices, hence the prices shown are the list prices when each home went under contract.
- Actual sold price average (after seller concessions)
- $759,200
- Average square footage
- 2,891 sq ft
- Actual sold price median (after seller concessions)
- $742,000
- Average seller concession
- $4,667
- Average days to sell (CDOM)
- 29
 SOLD
 SOLD
 SOLD
3 SOLD & CLOSED IN APRIL 2025
Three homes sold in April, with an average net price near $820,000—slightly above May's level. Cumulative days on market reached 244 days, marking the slowest pace of the year and sitting well above the full-year average of 119 days.
NOTE: Texas is a non-disclosure State for real estate sold prices, hence the prices shown are the list prices when each home went under contract.
- Actual sold price average (after seller concessions)
- $820,483
- Average square footage
- 3,168 sq ft
- Actual sold price median (after seller concessions)
- $824,500
- Average seller concession
- $1,050
- Average days to sell (CDOM)
- 244
 SOLDPool
 SOLDPool
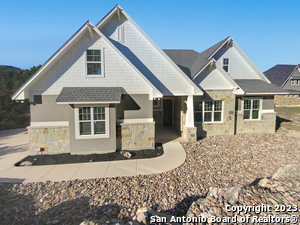 SOLD
1 SOLD & CLOSED IN MARCH 2025
A single home changed hands in March. It spent 63 days on the market, finding a buyer much faster than homes in both February and April and outpacing the full-year average of 119 days.
NOTE: Texas is a non-disclosure State for real estate sold prices, hence the prices shown are the list prices when each home went under contract.
- Square footage
- 4,239 sq ft
- Days to sell (CDOM)
- 63
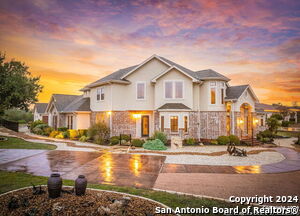 SOLDPool
4 SOLD & CLOSED IN FEBRUARY 2025
Four homes sold in February, with an average net price near $835,000. Cumulative days on market averaged 173 days, notably slower than both January and March as well as the neighborhood's annual average of 119 days.
NOTE: Texas is a non-disclosure State for real estate sold prices, hence the prices shown are the list prices when each home went under contract.
- Actual sold price average (after seller concessions)
- $835,004
- Average square footage
- 3,853 sq ft
- Actual sold price median (after seller concessions)
- $817,000
- Average seller concession
- $6,746
- Average days to sell (CDOM)
- 173
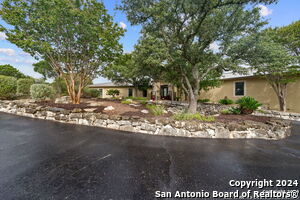 SOLD
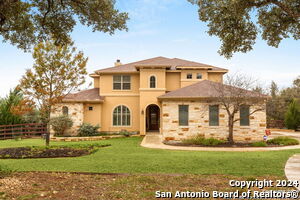 SOLD
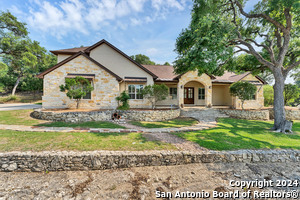 SOLDPool
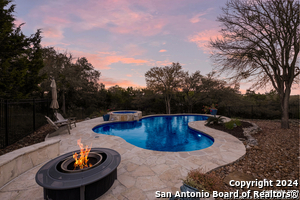 SOLDPool
1 SOLD & CLOSED IN JANUARY 2025
A single home sold in January to open the year. The property spent 58 days on the market, moving faster than February's sales and well ahead of the full-year average of 119 days.
NOTE: Texas is a non-disclosure State for real estate sold prices, hence the prices shown are the list prices when each home went under contract.
- Square footage
- 3,574 sq ft
- Days to sell (CDOM)
- 58
 SOLD